AUSTRALIA: Three Decades of Uninterrupted Growth 1991-2019
Key statistics from ATO Longitudinal Information Files
[Data and Methodologies] [Point-in-time Statistics] [Lifetime Statistics]
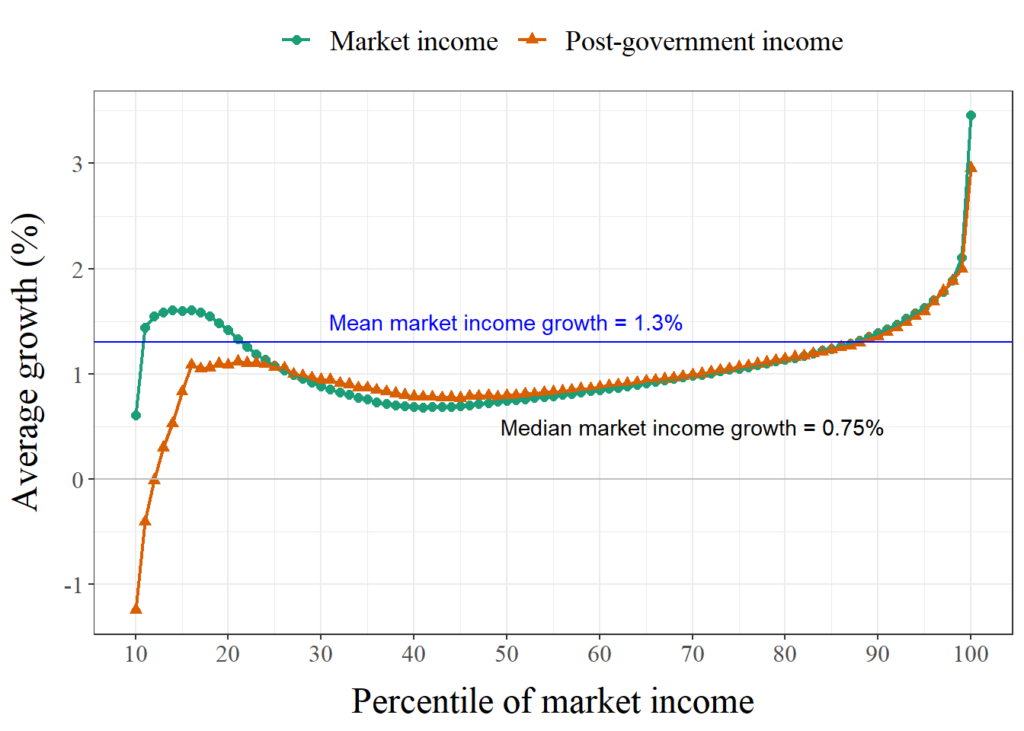
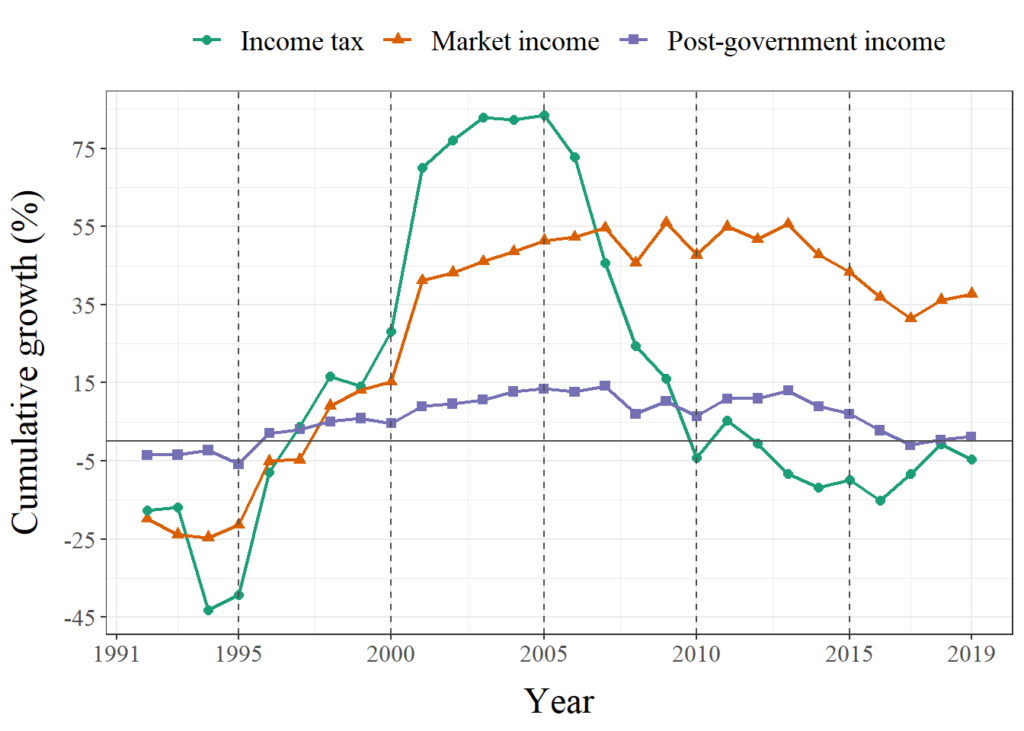
Growth: Uneven growth across group over time
![](http://mpf-lab.net/wp-content/uploads/2023/06/Cross_GIC_1999-2019_average-1-1024x731.png)
![](http://mpf-lab.net/wp-content/uploads/2023/06/Cross_Cg_Bottom_20_inc_pre_tax_net-1-1024x731.png)
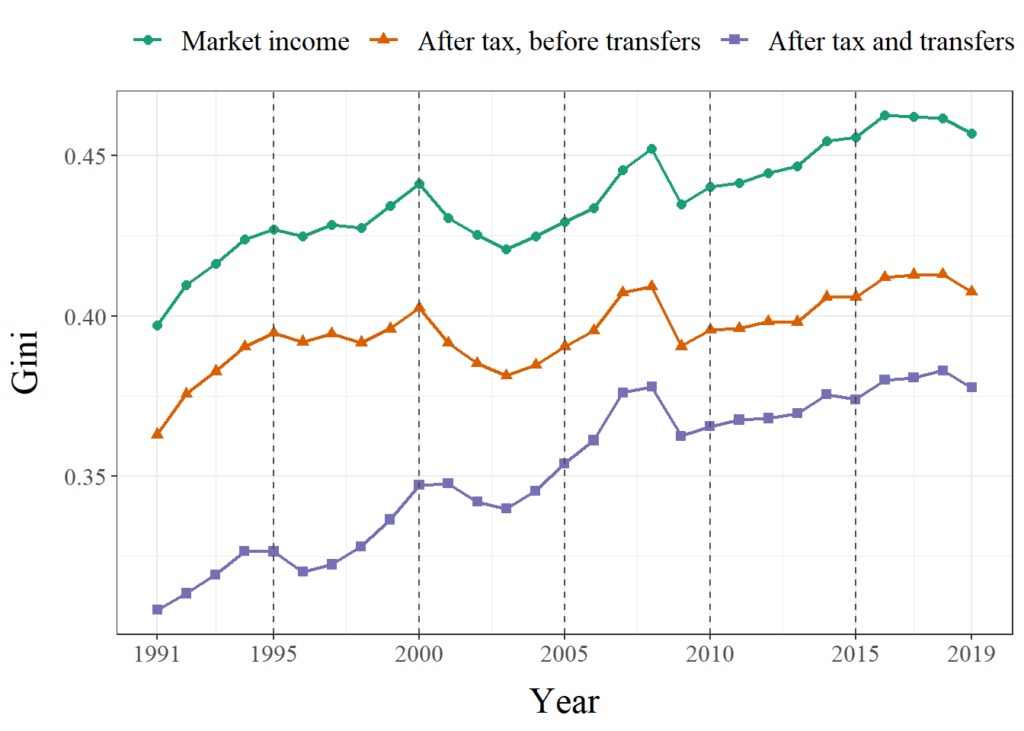
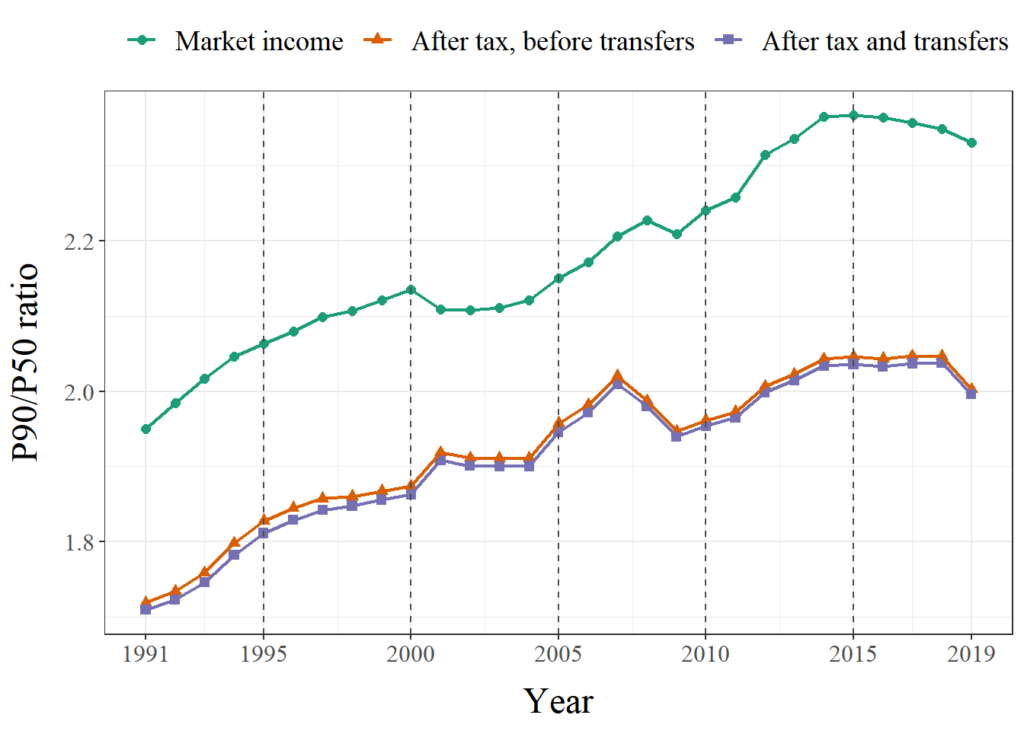
Inequality: Rising trend in income inequality
![](http://mpf-lab.net/wp-content/uploads/2023/06/Cross_Gini-1-1-1024x731.png)
![](http://mpf-lab.net/wp-content/uploads/2023/06/Cross_p90_p50-1-1024x731.png)
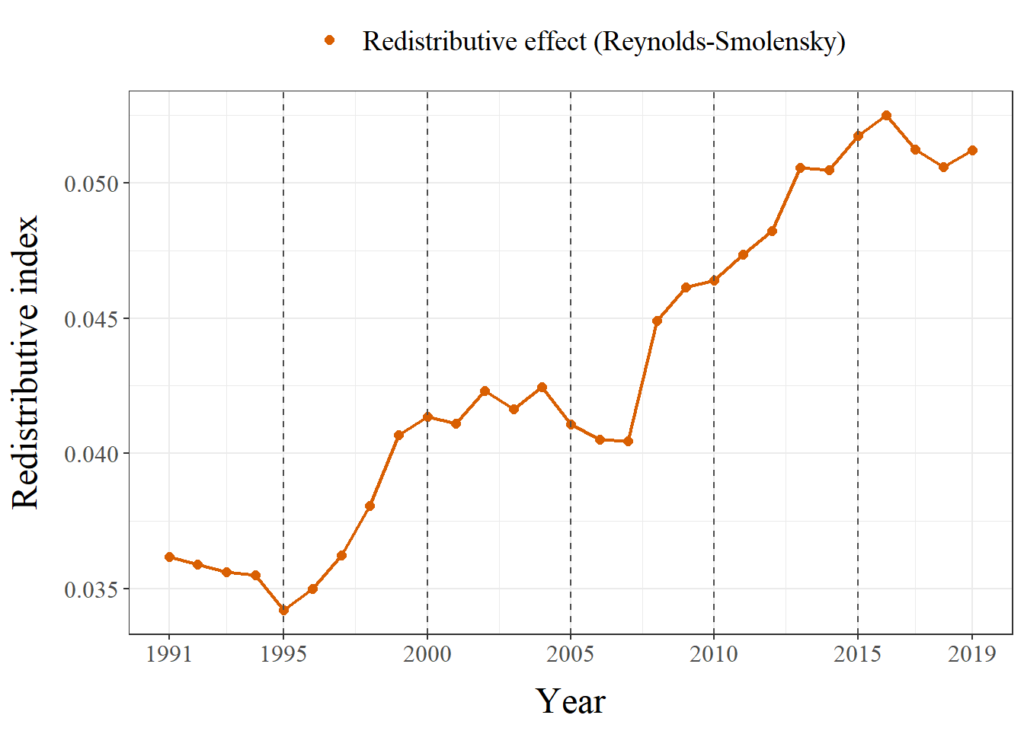
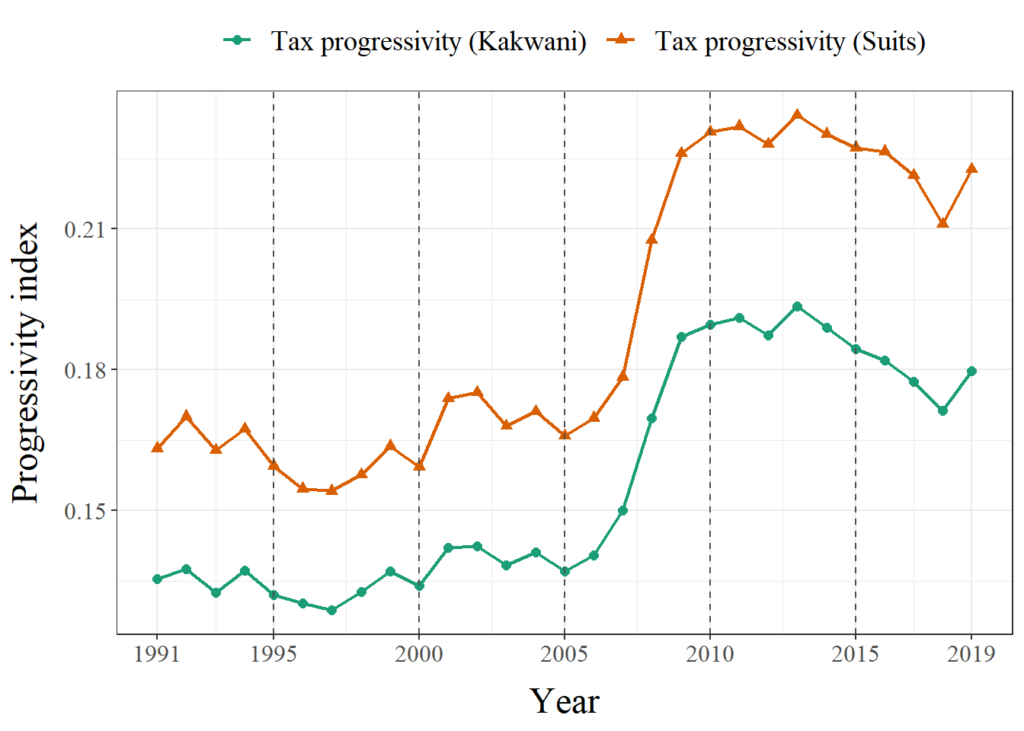
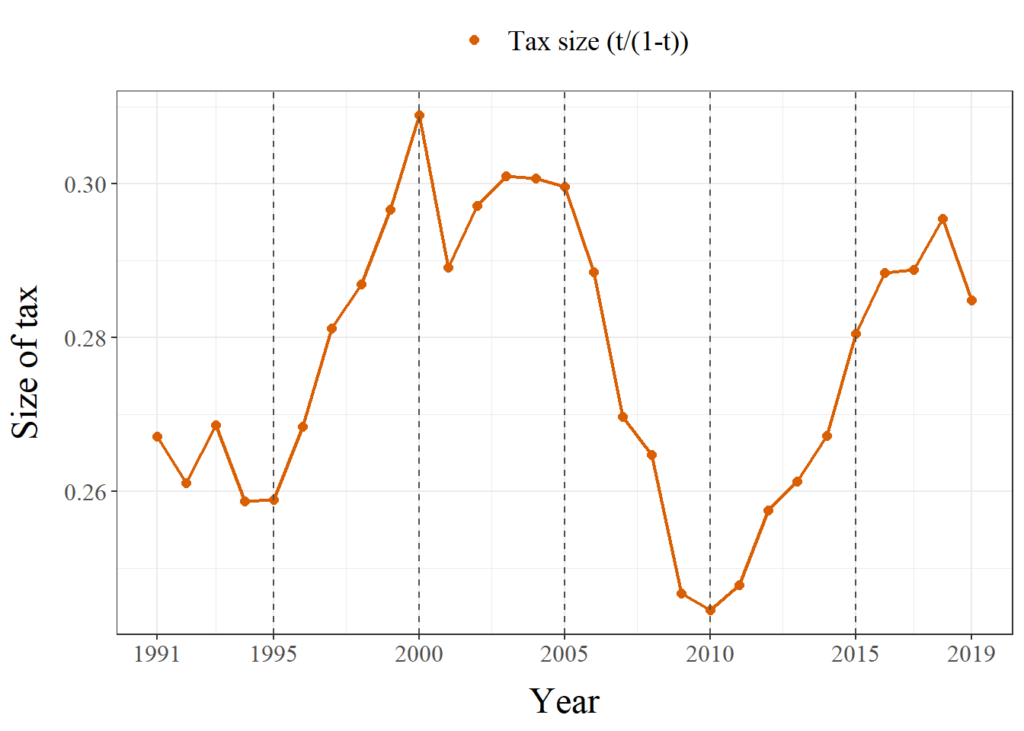
Redistribution: More progressive tax and smaller transfer
![](http://mpf-lab.net/wp-content/uploads/2023/06/Cross_Tax_RE-1-1024x731.png)
![](http://mpf-lab.net/wp-content/uploads/2023/06/Cross_Tax_progressivity-1-1-1024x731.png)
![](http://mpf-lab.net/wp-content/uploads/2023/06/Cross_Tax_size-1-1024x731.png)
![](http://mpf-lab.net/wp-content/uploads/2023/06/Cross_Transfer_RE-1-1024x731.png)
![](http://mpf-lab.net/wp-content/uploads/2023/06/Cross_Transfer_progressivity-1-1024x731.png)
![](http://mpf-lab.net/wp-content/uploads/2023/06/Cross_Transfer_size-1-1024x731.png)